Heatmap
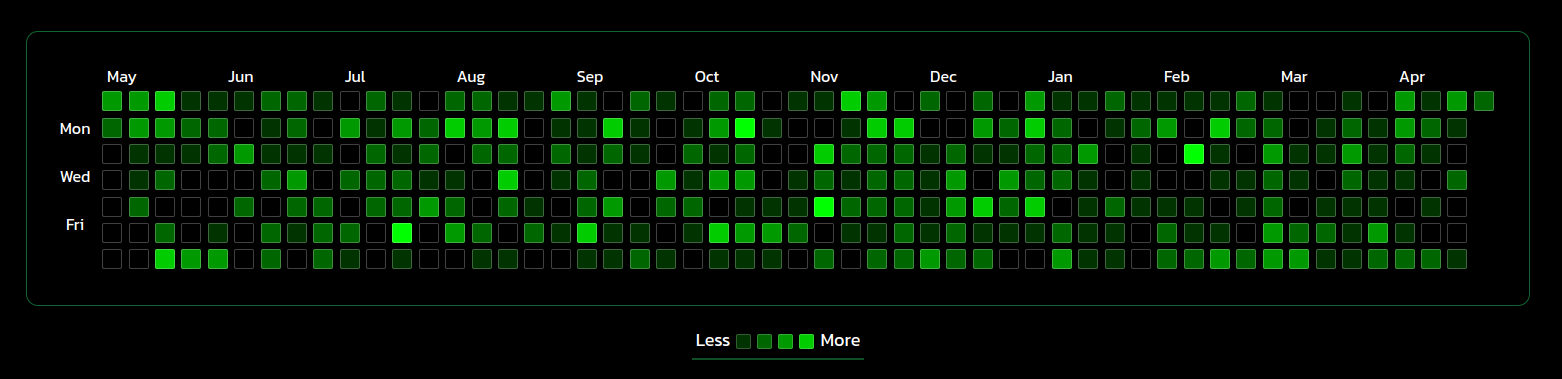
For generating the github contribution like heatmap,I have depicted each day of the past one year through a small div,
53 weeks each with 7 days make a complete 53*7 table representing each day in the last one year,each block represents a particular date (represented by dateBlocks[i][j]) and contain a track of the number of transactions made on that date (adding both debits and credits)(represented by dateTransactions[i][j]) based on this value each div is given an hsl value from the hue,saturation,lightness states.
 Total yearly debit and credit amounts are calculated and stored in
 yearlyDebit and yearlyCredit state variables respectively. Total number of transactions made in the year are also shown.